



Transportation infrastructure growth is not spread evenly. Two sub-sectors are forecast to grow at more than 25% a year. Three are forecast to grow at under 9%. And the largest market of the eight, by value, sits close to the bottom of the growth table, which makes any single average for transport as a whole nearly useless for planning.
That matters if you build electronic products for this sector. Capacity commitments, qualification programmes, and footprint decisions are all made years before the revenue arrives. A blended sector figure will point you at the wrong tender. So we pulled the published forecasts for eight transportation subsectors and charted them against one another.
What the transportation infrastructure growth data shows
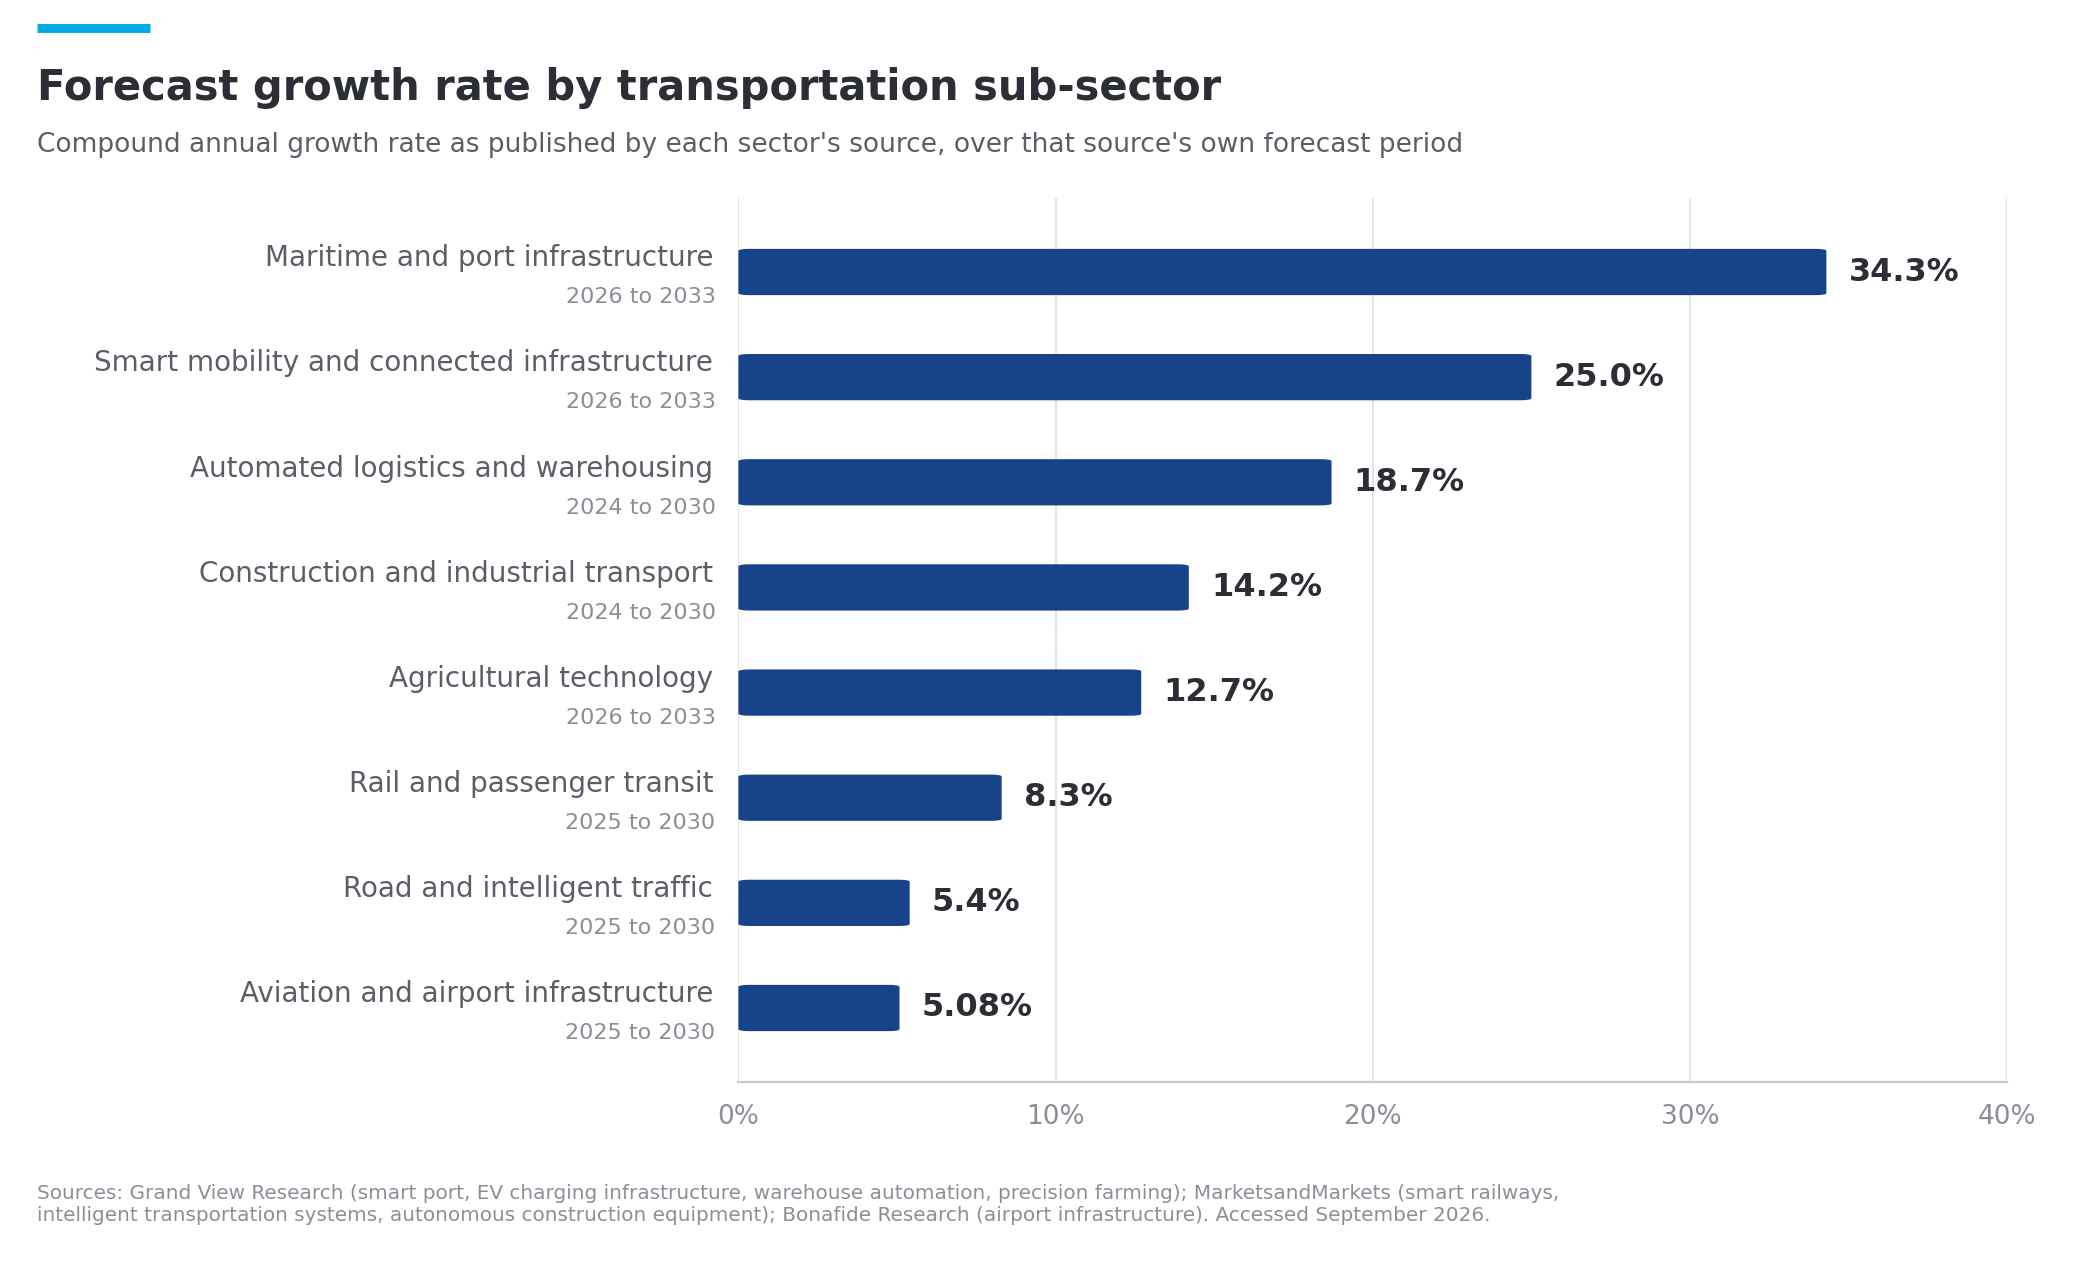
Smart port technology leads at a 34.3% compound annual growth rate from 2026 to 2033, taking the market from USD 4.0 billion in 2025 to a forecast USD 39.1 billion by 2033. Electric vehicle charging infrastructure follows at 25.0% over the same window, from USD 40.2 billion in 2025 to USD 238.8 billion by 2033. At the other end, aviation and airport infrastructure is forecast at 5.08% to 2030, and intelligent transportation systems at 5.4%.
A seven-fold difference between the top and bottom of a single sector is unusual. It tells you the growth is not coming from transport getting bigger. It's coming from specific parts of transport getting automated and connected.
The two sub-sectors pulling away
Ports are the standout, and they're also the least crowded from a supplier perspective. Container terminals are automating cargo handling, crane control, and vessel support at pace, and the electronics involved are rugged, industrial, and long-lived: control cabinets, industrial human-machine interfaces, marine navigation and communication equipment, and environmental monitoring hardware. Nothing unheard of, but all of it put considerable demand on ingress protection, corrosion resistance, and service life.
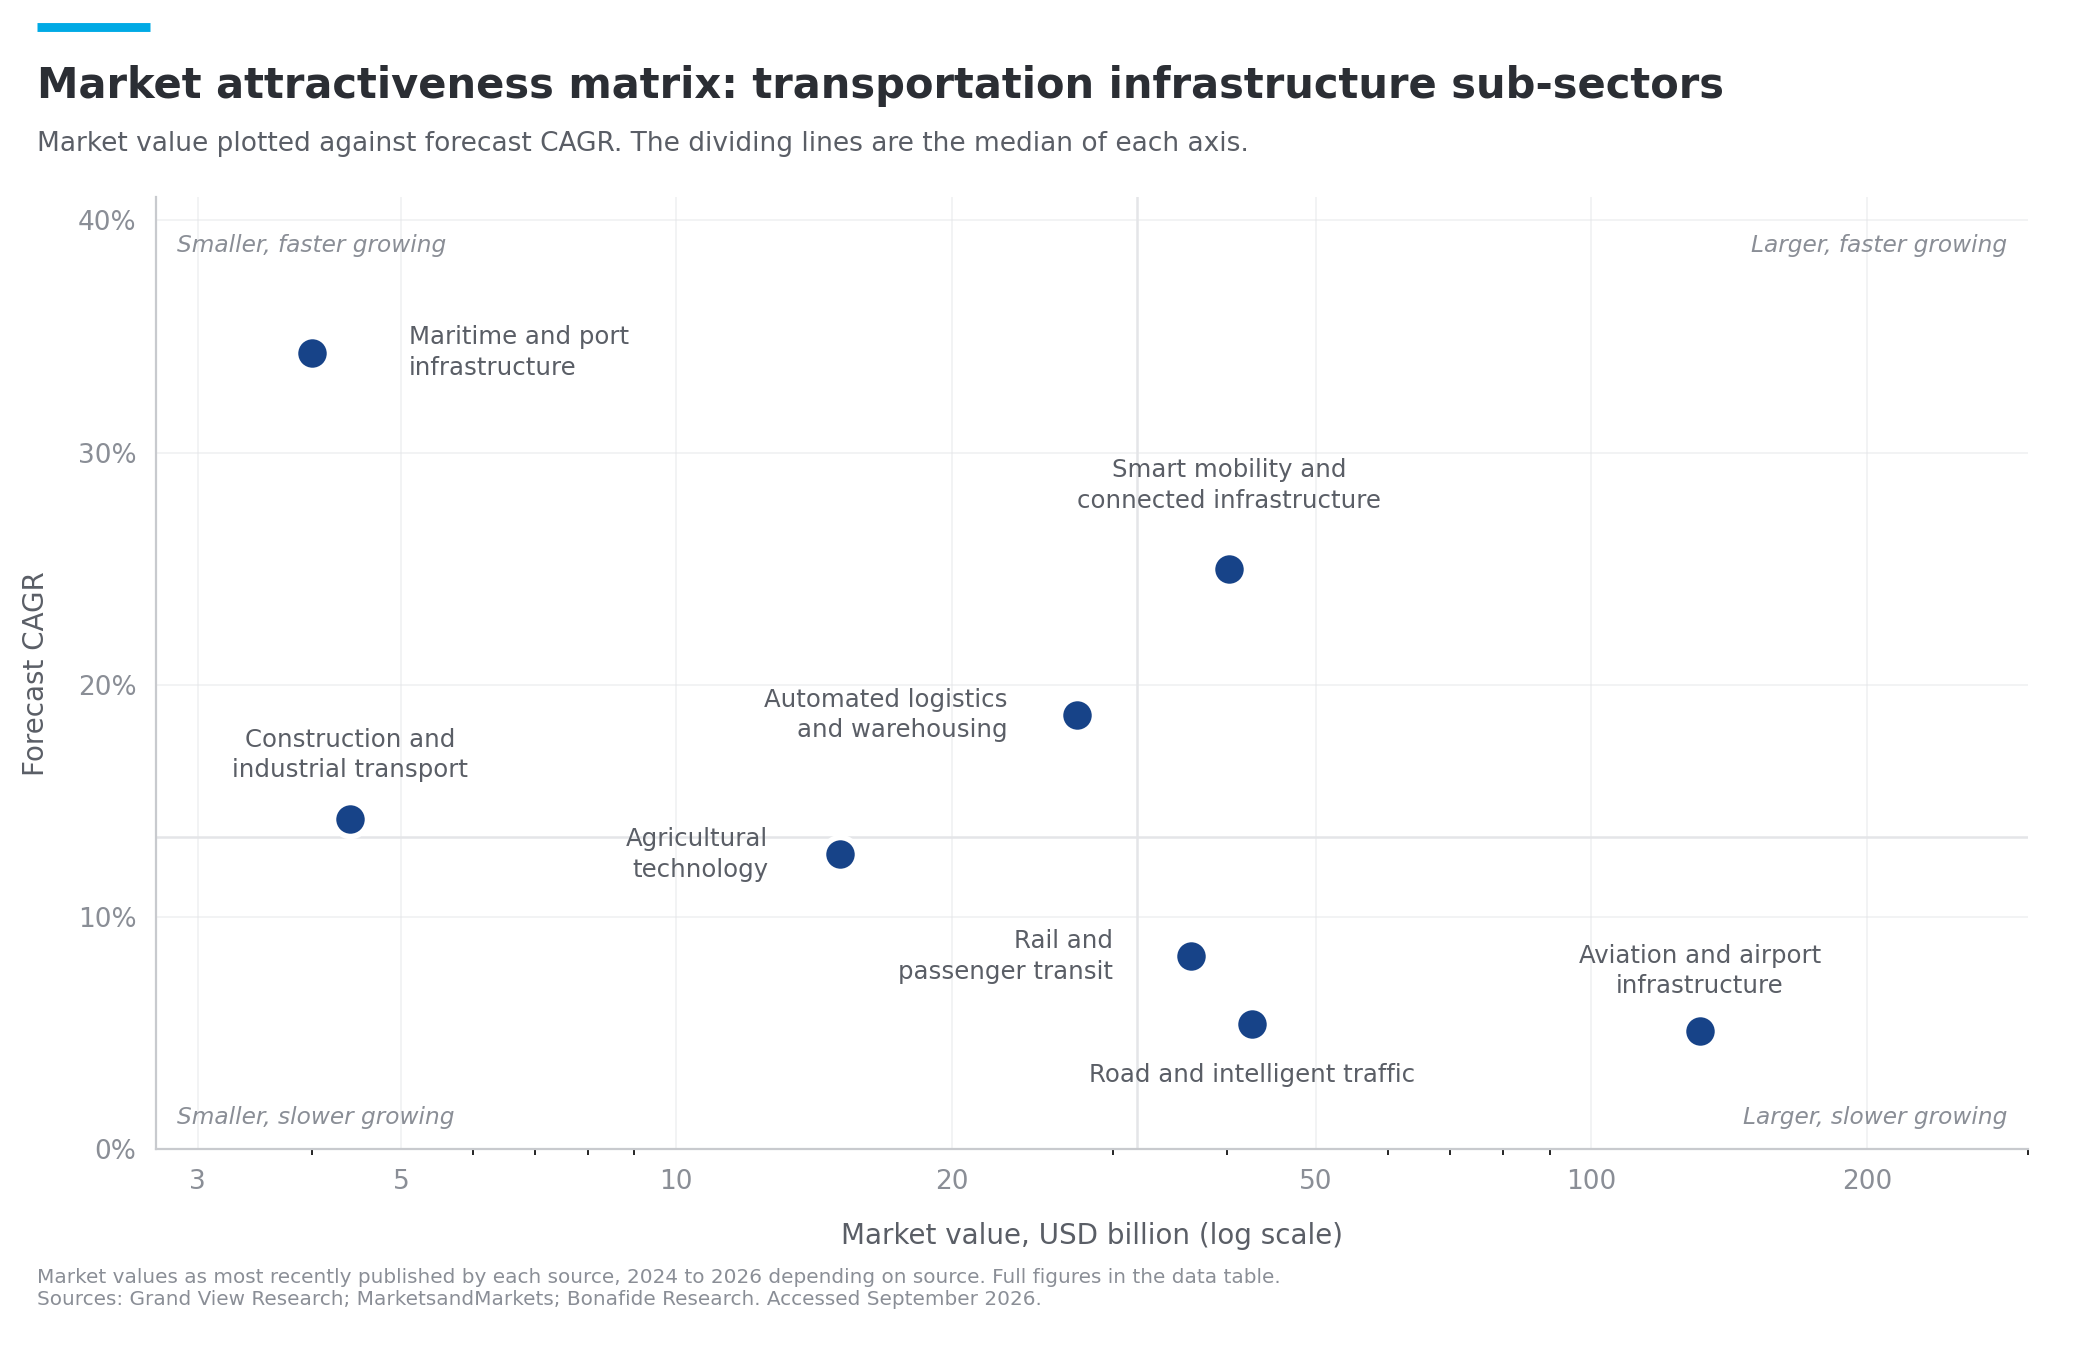
Smart mobility and connected infrastructure is the other one, and it's the only sub-sector that is both large and fast-growing. Charging hardware is the measurable part, but the wider category includes roadside units, vehicle-to-everything communication hardware, smart traffic controllers, payment terminals, and passenger information displays. Our look at automated parking systems covers one slice of that in more detail.
The practical implication for an OEM is about ramp risk rather than opportunity. A 25% to 34% growth rate means volumes that double roughly every two and a half to three years. Designs that were fine at pilot quantities start to fail on cost, test coverage, and supply continuity at that pace, and the redesign usually comes at the worst possible moment.
The large markets are growing slowly
Aviation is the biggest market in the set, at USD 131.37 billion in 2024 and forecast to reach USD 175.78 billion by 2030. Road and intelligent traffic infrastructure stands at USD 42.55 billion as of 2025, projected to reach USD 55.36 billion by 2030. Rail and passenger transit sits at USD 36.49 billion in 2025, forecast to reach USD 54.31 billion by 2030 at 8.3%.
Slower growth here does not imply weakness. These are mature markets with heavy regulation, long procurement cycles, and substantial replacement demand, and USD 44 billion of net growth in aviation alone over six years is not a small number. What changes is the shape of the opportunity. Growth in these sub-sectors comes from refresh and upgrade programmes against known specifications, not from new categories appearing. Qualification is the barrier to entry, and it rewards suppliers with the certifications and the documentation discipline already in place.
The middle tier, where automation is the common thread
Three sub-sectors sit in double digits without leading:
- Automated logistics and warehousing is forecast at 18.7% from 2024 to 2030, growing from USD 27.4 billion in 2026 to USD 59.5 billion by 2030.
- Autonomous construction equipment is forecast at 14.2%, from USD 4.40 billion in 2024 to USD 9.77 billion by 2030.
- Precision farming is forecast at 12.7% from 2026 to 2033, from USD 15.1 billion in 2025 to USD 38.8 billion by 2033.
They look like three separate markets, but from a manufacturing standpoint, they're closer to one. Automated guided vehicle controllers, machine vision cameras, telematics modules, electronic control units, and industrial touch terminals recur across all three, and the labour constraint driving adoption is the same in a warehouse, on a building site, and in a field.
Plot value against growth, and the picture sharpens
| Sub-sector | Market value | Forecast value | CAGR |
| Maritime and port infrastructure | USD 4.0bn (2025) | USD 39.1bn (2033) | 34.3% |
| Smart mobility and connected infrastructure | USD 40.2bn (2025) | USD 238.8bn (2033) | 25.0% |
| Automated logistics and warehousing | USD 27.4bn (2026) | USD 59.5bn (2030) | 18.7% |
| Construction and industrial transport | USD 4.40bn (2024) | USD 9.77bn (2030) | 14.2% |
| Agricultural technology | USD 15.1bn (2025) | USD 38.8bn (2033) | 12.7% |
| Rail and passenger transit | USD 36.49bn (2025) | USD 54.31bn (2030) | 8.3% |
| Road and intelligent traffic | USD 42.55bn (2025) | USD 55.36bn (2030) | 5.4% |
| Aviation and airport infrastructure | USD 131.37bn (2024) | USD 175.78bn (2030) | 5.08% |
Charted together, the sector splits cleanly. Ports sit top left: small today, growing fastest, and still relatively open. Smart mobility sits top right on its own, which is the rare combination of scale and momentum. Aviation, road, and rail cluster along the bottom, large and steady. Logistics, construction, and agricultural technology fill the middle.
The useful part is what the empty space says. There is no large, fast-growing, established sub-sector waiting to be served. Every high-growth position in transport currently requires either taking on a small market early or competing in the one crowded category that has both.
Fast growth and hard engineering tend to arrive together
The fastest-growing sub-sectors share an awkward property: they put electronics outdoors, in salt air, on vibrating equipment, or inside enclosures that need to survive twenty years of thermal cycling. A roadside charging unit and a quayside crane cabinet face very different duty cycles and very similar failure modes.
That pushes the engineering decisions forward. Enclosure design, conformal coating, thermal management, sealing, and electromagnetic compatibility all get cheaper to solve at the design stage than after a field failure, which is the argument for treating ruggedisation in electronics design as a specification input rather than a later revision. The same logic applies to test coverage. Products that will scale at 25% a year need test strategies that scale with them.
What the data means for transport electronics capacity
The pattern across all eight sub-sectors is the same underlying shift: automation, connectivity, and electrification, arriving at very different speeds, but the hardware is more consistent than the market labels suggest. Rugged enclosures, industrial control cabinets, internet of things gateways, human-machine interfaces, and sensor assemblies all show up in a port, a charging network, a warehouse, and a harvester alike.
That's useful because it means the capability built for one transport sub-sector is transferable to the others. ESCATEC is an EMS partner with more than 40 years of building exactly this class of product, and our transportation electronics manufacturing work spans road, rail, aviation, maritime, smart mobility, and industrial transport.
Our vertically integrated capabilities across design, development, and DfX, printed circuit board assembly, box build assembly, mechatronics, machining, and injection moulding mean a product can move from prototype to volume without changing partners, and our footprint across the UK, Malaysia, Switzerland, the Czech Republic, and Bulgaria supports nearshoring, co-shoring, and offshoring as demand shifts.
Conclusion
The growth in transportation infrastructure is trackable, but it's concentrated in places that are easy to miss if you read the sector as a single market. Ports are growing fastest from the smallest base. Smart mobility is the only sub-sector with both scale and speed. Aviation, road, and rail carry the volume and the replacement demand. The middle tier is one automation story wearing three different labels.
For an OEM, the decision that follows is not which market to chase. It's about whether your product and supply chain can absorb the ramp if the fast-growing forecast proves right.
If you're planning transport electronics capacity for the next three to five years, talk to our team about where the design and manufacturing risk actually sits.

FAQs
1. Which transportation infrastructure sector is growing the fastest?
Maritime and port infrastructure. Grand View Research forecasts the smart port market to grow at a 34.3% compound annual growth rate from 2026 to 2033, reaching USD 39.1 billion by 2033 from USD 4.0 billion in 2025. It is the fastest-growing transport sub-sector on published forecasts, and the smallest of the eight by current market value.
2. Which transportation sub-sector is the largest by market value?
Aviation and airport infrastructure, valued at USD 131.37 billion in 2024 by Bonafide Research and forecast to reach USD 175.78 billion by 2030. It is roughly three times the size of the next largest sub-sector, and among the slowest growing at a 5.08% forecast CAGR.
3. Why do transportation growth forecasts vary so much between sub-sectors?
Because the growth is driven by automation, connectivity, and electrification rather than by transport volumes. Sub-sectors early in that transition, such as ports and electric vehicle charging, grow from a small base at high rates. Mature, heavily regulated sub-sectors such as aviation and rail grow through replacement and upgrade cycles instead.
4. What do these market forecasts mean for an OEM planning manufacturing capacity?
A 25% to 34% annual growth rate implies volumes doubling roughly every two and a half to three years. Designs that work at pilot volumes often fail on cost, testability, or supply continuity at that pace. The practical implication is to validate manufacturability, test strategy, and supply chain resilience before the ramp, not during it.